Crypto Taxes the Hard Way: Historical Prices
- Export from CoinPaprika
- Hack Hledger to import price feeds
- Track portfolio value
- Plot portfolio value
- What is it good for?

Disclaimer: nothing on this blog is advice about the substance of your taxes. I have no background in accounting and no idea whether this code will produce valid results in your (or any!) tax situation.
Today we’ll be adding historical crypto price data to hledger and using it to track portfolio value. It’s also important for calculating taxes on staking income. I’ll do a separate post on that.
Here is a tarball of the code, or you can read it on GitHub.
The top-level files are one-off demos, but import/coinpaprika will slot into the rest of the “full-fledged” system if you want it to.
Export from CoinPaprika
I tried CoinGecko and a Kaggle dataset first, but settled on CoinPaprika because they let you download the complete price history for many different coins/tokens conveniently. No API account signup, no wasted time pasting paginated data into a spreadsheet!
The only downside is that it’s low resolution weekly data rather than daily or hourly. I think that should be OK for most purposes because whenever you buy or sell something that already has a real price; the historical data is only for estimating what you could have sold things for on different dates. And that’s inherently a little vague because it would have depended on how and when you did it. So as long as you’re not cherry picking the data in your favor I think any reasonable authority would be OK with it. (Again: not tax advice. I don’t know whether your authorities see it that way.)
We’ll use Ethereum as an example.
Go to the coin page, set the chart range to Max, and Export → CSV.
The link worked for me in Chromium but not Firefox.
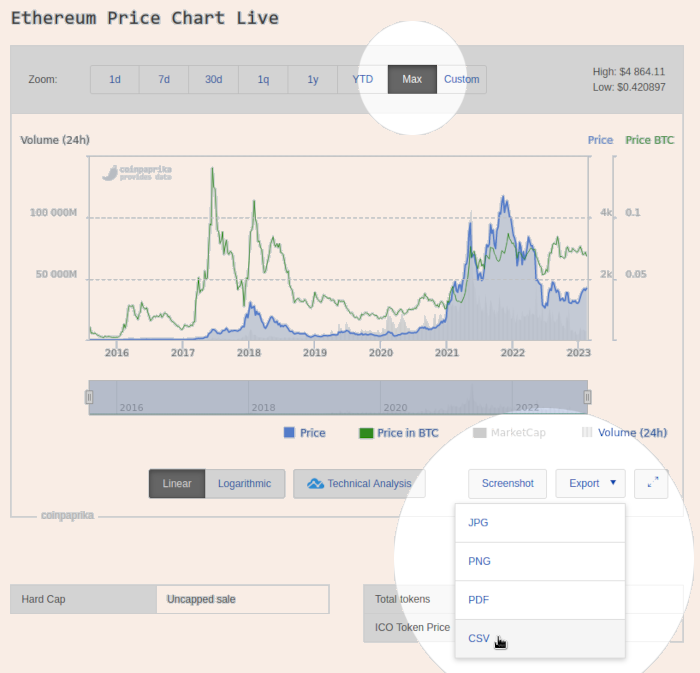
The data should look like this:
"DateTime","Price","Price in BTC","Volume (24h)"
"2015-08-03 00:00:00",2.9379853153153,0.010536816026859,145781
"2015-08-10 00:00:00",1.4312609722222,0.0054110598511272,2518067
"2015-08-17 00:00:00",1.3534692708333,0.0057977101345057,1796680
...
"2023-01-30 00:00:00",1672.2780124628,0.07017126906523,8394707643
"2023-02-06 00:00:00",1620.9206133282,0.071827640577938,6702235129
"2023-02-13 00:00:00",1688.5364890397,0.068847315571221,7708162827
Hack Hledger to import price feeds
I got coinpaprika.rules to generate almost-valid market price directives using empty transactions with just a date and description, then cleaned up the output in csv2journal.
# import/coinpaprika/coinpaprika.rules
skip 1
fields date,price,price_btc,volume_24h
date-format %Y-%m-%d %H:%M:%S
description ETH %price USD
# import/coinpaprika/csv2journal
hledger print --rules-file coinpaprika.rules -f "$1" | while read line; do
[[ -z "$line" ]] || echo "P $line"
doneI’ll do a post later that includes how to infer ETH from the filename rather than hard-coding it in the description.
Another minor improvement would be to do everything in csv2journal and skip the rules file, but I’ll leave that as an exercise. The general philosophy is that hacks are fine as long as you version control them!
Let’s try it.
This is roughly what export/export.hs in the “full-fledged” system will do if you include ./import/coinpaprika/journal/coinpaprika-ETH.journal from one of the top-level journal files:
$ cd historical-prices
$ nix-shell
[nix-shell]$ cd import/coinpaprika
[nix-shell]$ chmod +x csv2journal
[nix-shell]$ mkdir journal
[nix-shell]$ ./csv2journal csv/coinpaprika-ETH.csv > journal/coinpaprika-ETH.journal
P 2015-08-03 2.9379853153153 USD
P 2015-08-10 1.4312609722222 USD
P 2015-08-17 1.3534692708333 USD
...
P 2023-01-30 1672.2780124628 USD
P 2023-02-06 1620.9206133282 USD
P 2023-02-13 1688.5364890397 USDTrack portfolio value
We’ll start a minimal portfolio.journal here for clarity.
You can do the same thing with all.journal later.
Here are the files we’ve used so far along with the new journal:
historical-prices
├── import
│   └── coinpaprika
│       ├── coinpaprika.rules
│       ├── csv2journal
│       ├── csv
│       │   └── coinpaprika-ETH.csv
│       └── journal
│           └── coinpaprika-ETH.journal
├── portfolio.journal
└── shell.nix
;; portfolio.journal
commodity 1000.00 USD
commodity 1000.00 ETH
2015-08-04 Buy 1 ETH back in the day
assets:wallets:ancient 1 ETH
equity:opening balances
include ./import/coinpaprika/journal/coinpaprika-ETH.journalOK, so Hledger commands can be a little cryptic. When trying something new I tend to look in the manual, this cheetsheet, and then forum posts if needed. One nice feature is that order usually doesn’t matter, so you can tack more flags on the end to incrementally improve it.
This command says “Using the file portfolio.journal, show the historical balances at the end of each year until today, converted to USD value, only for accounts with ‘assets’ in their names, and transpose the table”. Whew!
[nix-shell]$ hledger -f portfolio.journal bal --historical -Y -e today -X USD assets --transposeEnding balances (historical) in 2015-01-01..2023-12-31, valued at period ends:
|| assets:wallets:ancient |
============++========================+=============
2015-12-31 || 0.95 USD | 0.95 USD
2016-12-31 || 8.14 USD | 8.14 USD
2017-12-31 || 728.19 USD | 728.19 USD
2018-12-31 || 151.80 USD | 151.80 USD
2019-12-31 || 129.39 USD | 129.39 USD
2020-12-31 || 741.34 USD | 741.34 USD
2021-12-31 || 3709.23 USD | 3709.23 USD
2022-12-31 || 1197.17 USD | 1197.17 USD
2023-12-31 || 1688.54 USD | 1688.54 USD Plot portfolio value
Did you notice that today’s shell.nix includes tidyverse?
That’s so that as a final sanity check we can increase the reporting frequency to weekly (-W) and plot USD value over time. Our 1 ETH “portfolio” should come out looking like the CoinPaprika chart at the top…
# save-portfolio-table.sh
echo 'date usd_value' > portfolio.tsv
hledger -f portfolio.journal bal --historical \
  assets -X USD -W -e today -X USD --transpose |
  grep '^\s*20' | awk '{print $1, $3}' \
  >> portfolio.tsv
# plot-portfolio-table.R
require(tidyverse)
read_delim('portfolio.tsv') %>%
ggplot(aes(x=date, y=usd_value)) +
geom_line() +
ggtitle('Historical value of ETH in USD') +
xlab('') +
ylab('') +
theme_classic() +
theme(aspect.ratio=1/2)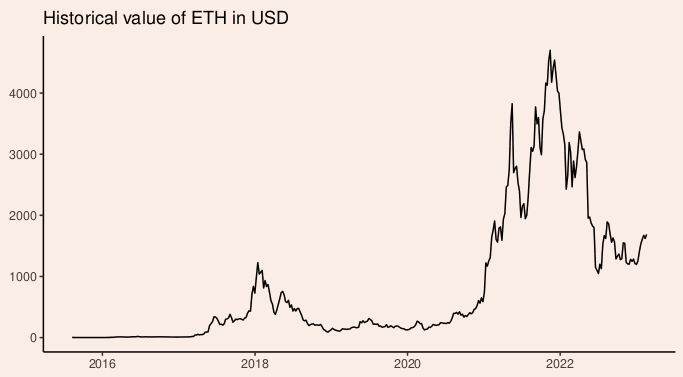
What is it good for?
This might seem trivial because we got the same chart back at the end, but now we’re close to a general solution! With a few more tweaks this can keep track of a real portfolio as we buy/sell/transfer things over time. In future posts I’ll explain how to make portfolio value a report in the “full-fledged” system and how to add more detailed charts by currency, location (bank/exchange/wallet), or accounting category (assets/liabilities/income/expenses).